


4 min read
Selling Liquor Online: Benefits and How To Get Started
Nearly a quarter of all retail purchases now happen outside the walls of a physical store.

You might offer the friendliest customer service, the most organized shelves and displays, and the best selection of beer, wine, and spirits in town — and still not be profitable. That's because liquor store success is a numbers game.
Without a solid grasp on key performance indicators (KPIs), you might lose money on the bottles you think are bestsellers, tie up capital in underperforming products, and miss out on opportunities to boost customer satisfaction and sales.
But don’t worry — this blog covers everything you need to know about liquor store sales tracking, your customers’ behavior, inventory trends, and your store’s overall financial performance.

Before we dive into specific metrics, let’s talk about how to track your liquor store’s data.
Without the right tools, monitoring your business' financial health can quickly get overwhelming. If you’re still relying on generic reports and scattered spreadsheets, it’s time for an upgrade.
Look for a point of sale (POS) system specifically designed for liquor stores that includes powerful reporting and analytics capabilities. Your software should track your store’s data in real time, analyze it, and give you insights you can actually use.
Now, let’s explore some specific ways you can use your POS system’s sales reports to take your liquor store to the next level.
Free Resource: How to Choose The Best Liquor Store POS System For Your Needs
For liquor store success, you need to understand your customers. Your sales reports can help you identify their favorite products, shopping habits, and seasonal patterns — which helps you make smarter stocking, marketing, and even display decisions.
Let’s look at five metrics and reports that can help you design a liquor store’s shopping experience for your customers’ unique wants and needs.
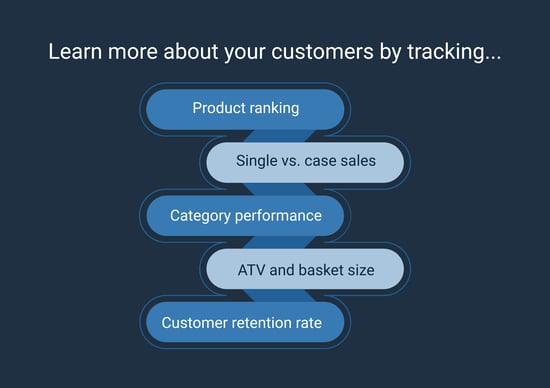
First, you need to know which bottles are flying off the shelves — and which ones are simply collecting dust. To distinguish between your bestsellers and underperformers, you need a POS feature called automated ranking.
Automated ranking uses your liquor store sales tracking data and AI to assign an A through D grade to each of your bottles. It should also color-code them for easier identification.
Bottles with an A ranking have high inventory turnover and high profit margins, meaning you should emphasize them in your marketing emails and texts, in-store displays, and recommendations.
Bottles with a D ranking are either sitting on your shelves for too long or are unprofitable. You might offer a buy one, get one (BOGO) or mix and match deal to move them, then replace them with something else your customers prefer.
Are your customers taste testers or party planners?
Your liquor store sales reports can tell you. Simply compare sales of single bottles of beer or wine to sales of full cases.
If single bottles are the majority of your sales, appeal to your casual customers by offering build-your-own six-pack deals, mix and match discounts on your bestselling wines, or even tasting events.
If you sell several cases each week, make it easier for busy customers to navigate your store by displaying cases near the entrance.
Craft beer lovers, cocktail connoisseurs, and amateur sommeliers. All three types of customers frequently visit your liquor store, but it’s helpful to know who you make the most money from. That’s where your category performance report comes in.
When you add SKUs to your POS system’s inventory database, you can tag them with categories or subcategories — like “wine,” then “red wine,” and even “cabernet sauvignon.”
From there, you can see how each category performed and compare categories against each other. For example, you can compare domestic versus imported beers, well known versus premium liquors, or red wines and white wines.
Understanding your bestselling categories can help you make better stocking decisions in the future, design a store layout that caters to your customers’ preferences, and launch more effective promotions.

You don’t just need to know what customers are buying — you also need to know how much. Average transaction value (ATV) represents the average dollar value of each transaction in your liquor store, while basket size represents the number of bottles customers generally purchase during each shopping trip.
If your ATV is low, consider promoting your premium options more heavily. You might offer taste tests of fine wines and premium spirits, print educational signage to point out your best bottles, or rearrange your store’s layout and displays to highlight more profitable products.
For a full breakdown of how to use and improve this metric, see our full guide to liquor store KPIs.
Wondering how happy shoppers are with your liquor store? Look to your customer retention rate for the answer. This liquor store sales metric represents the percentage of customers who return to make repeat purchases.
A low customer retention rate is essential because it keeps marketing costs low and ensures steady revenue. To increase yours, consider launching a loyalty program to reward shoppers every time they make a purchase.
We’ve covered how liquor store sales tracking can help you build stronger customer relationships — now let’s explore how it can help you manage inventory more effectively.
Here are four inventory KPIs and reports to watch.
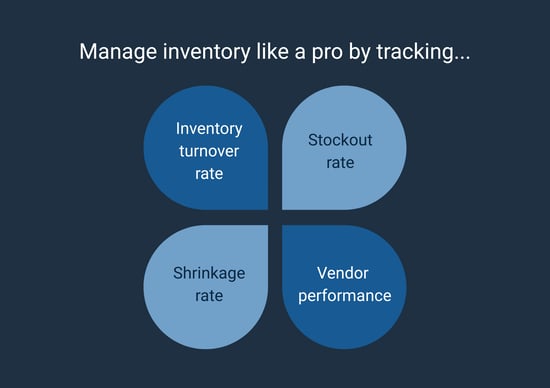
Healthy liquor store cash flow depends on steady inventory movement — which you can track by using your POS system’s inventory turnover reports. Your inventory turnover rate represents the average time a bottle sits on your shelf before it sells.
If your inventory turnover rate is low, you’re likely dealing with low foot traffic, low sales volume, and the risk of dead stock. If it’s high, you’ve got steady business — but you might encounter unexpected stockouts.
Knowing the turnover rate for each of your products can help you make data-driven ordering decisions to meet customers’ needs while protecting your cash flow.
Tired of running out of your bestsellers on a busy Friday night? You need to keep a close eye on your stockout rate.
This report reveals which products are most likely to run out — as well as how often you experience stockouts. You can use this data to make a rock-solid reordering plan so that you never lose a sale.
Pro tip: You can also avoid stockouts by setting up automated reordering in your POS system. This feature monitors your stock levels in real time, then automatically generates a purchase order to replace low-stock bottles, saving you time and preventing costly stockouts.
Broken and stolen bottles can wreak havoc on your bottom line — but closely monitoring your shrinkage rates can help you be proactive about protecting your inventory.
A certain amount of shrinkage is inevitable, but liquor store sales tracking can help you spot excessive breakage or theft rates. From there, you can implement more robust security systems, like installing cameras, locking up your most expensive bottles, or adjusting your store’s layout to place frequently-stolen bottles near the checkout counter.
Some POS systems integrate with your security cameras to protect your store even further.
Reliable, affordable vendors are a must-have ingredient for liquor store profitability, and your liquor store sales tracking can help you identify which ones are worth your time and money.
Since your POS system monitors outgoing and incoming inventory, you can use it to monitor your suppliers’ performance. Track how much you spend on each shipment, when new stock typically arrives, and the accuracy of each order.
When new inventory arrives, all you have to do is scan the invoice, scan the barcodes of new bottles and cases, and compare your invoice and purchase order to make sure you received everything you paid for.
Turning a profit is every liquor store owner's ultimate goal, but it doesn’t happen by accident. You have to closely monitor your operating expenses, generate steady revenue, and make data-driven pricing decisions.
Here are four metrics to help you monitor and improve your liquor store’s financial health.
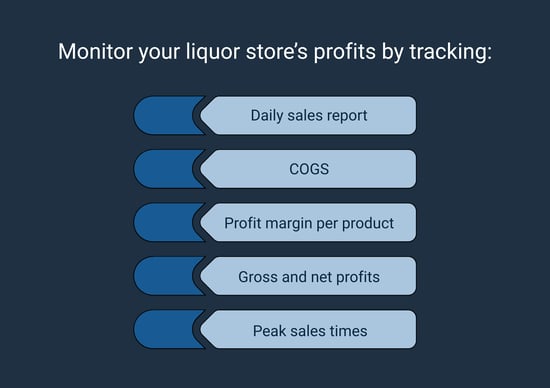
Your daily sales report is exactly what it sounds like. It shows the number of transactions, value per transaction, total revenue, total profit generated, and bestsellers each day.
Closely monitoring your daily sales reports can help you spot areas for improvement. For example, you can see which cashiers generate the most sales, identify when your store is busiest, and see how customers’ shopping behaviors change throughout the week.
Liquor store success isn’t just about making more money — it’s also about controlling your operating expenses. Inventory cost is generally the largest expense for liquor store owners by far, and without the right data, your inventory spending can quickly get out of control. That’s why you need to monitor your cost of goods sold (COGS).
This metric represents how much it costs to stock your store, including the wholesale and shipping costs of new inventory. Knowing your COGS is essential for setting the right prices and ensuring you turn a profit on every single sale.
Most importantly, you need to know your liquor store’s profit margins. Here are three specific metrics to track:
Understanding your gross and net profit margins is a must for liquor store success, but knowing your per-product profit margins can take your earnings to the next level.
Bonus Resource: Check out our suggested pricing calculator for the most common beer, wine, and liquor SKUs!
Your liquor store’s sales performance looks different throughout the day, week, and year — which is why you need seasonal and peak sales times reports.
These reveal how your customers’ shopping behavior changes over time. For example, your busiest times might be evenings, weekends, and holidays. You can also identify which products are most popular during certain time periods, like red wines in winter and margarita mix during summer.
Use these insights to shape your operating hours, marketing strategy, and in-store displays.
Congratulations! Now you’re a liquor store sales tracking expert.
Ready to dig into your store’s data? Let’s make sure your POS system is up to the task.
Bottle POS includes all the reports you need to track these metrics and more — plus must-have features like:
Take our liquor store software for a spin by scheduling your live, personalized demo today!

Bottle POS was designed to be smart and simple. Instead of having hundreds of features that liquor store owners won't use, we concentrate on the features that really make a difference.


